11 min read
A free FortiGate log analysis platform with OpenSearch
FortiAnalyzer licensing is not cheap, and firewall log analysis is not a hard problem. This is a record of building an equivalent system locally out of OpenSearch and Logstash, both open source.
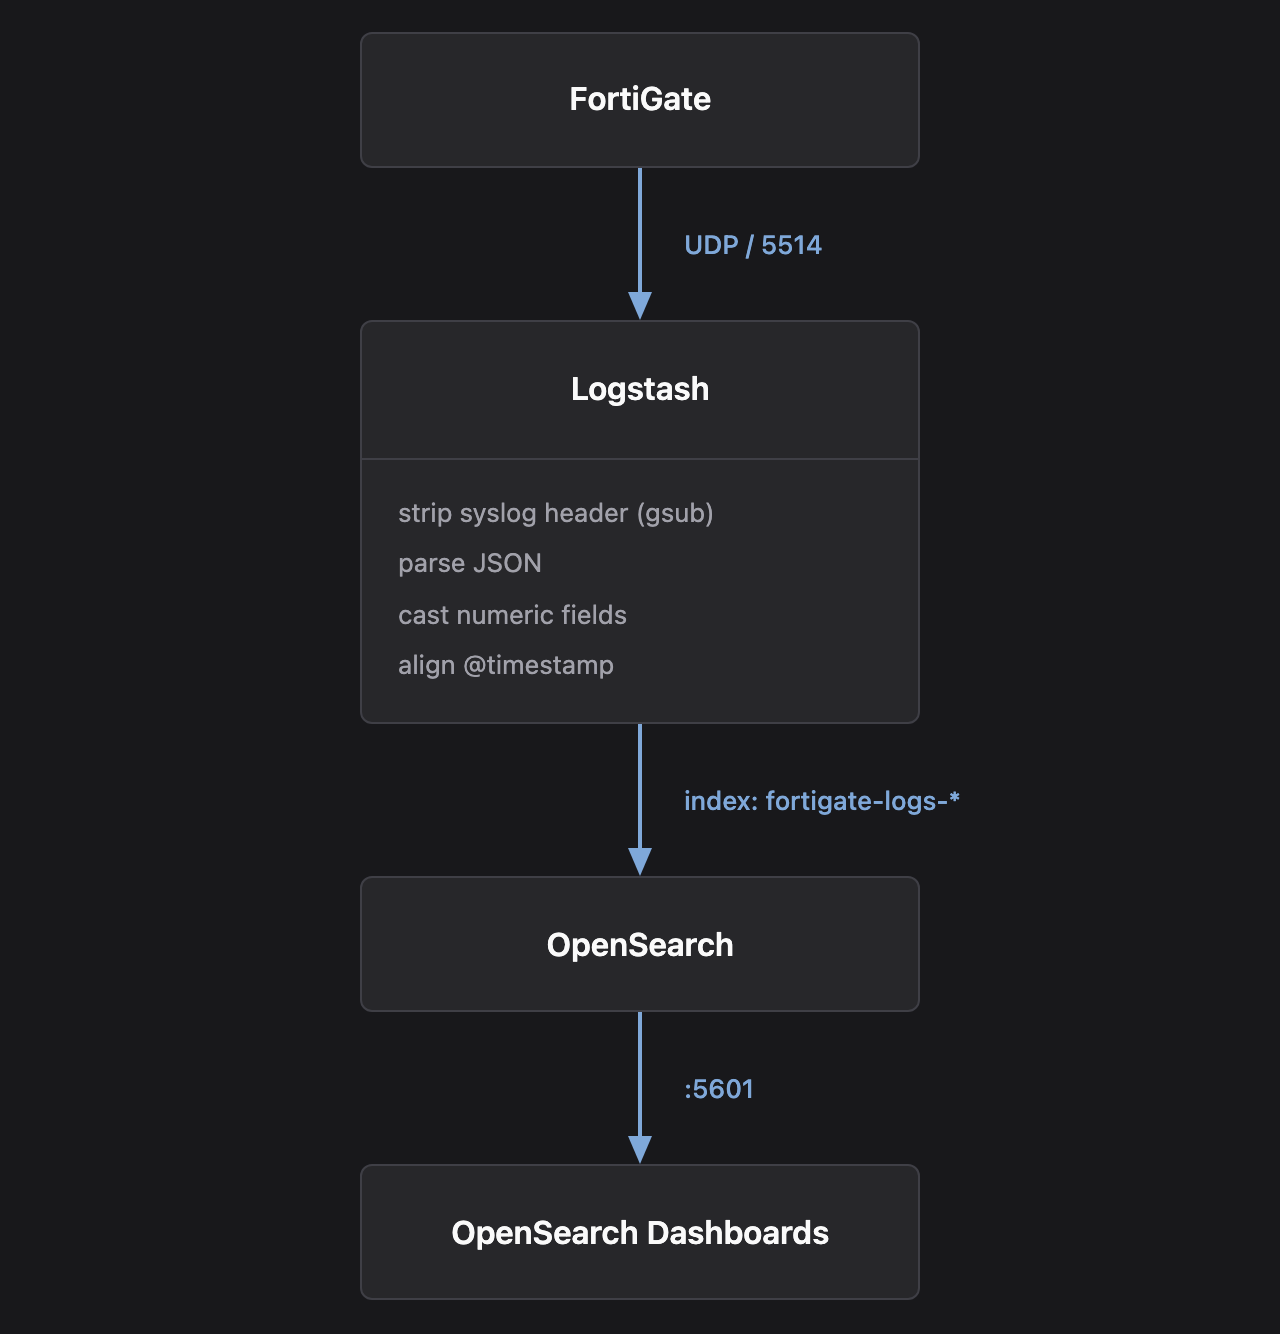
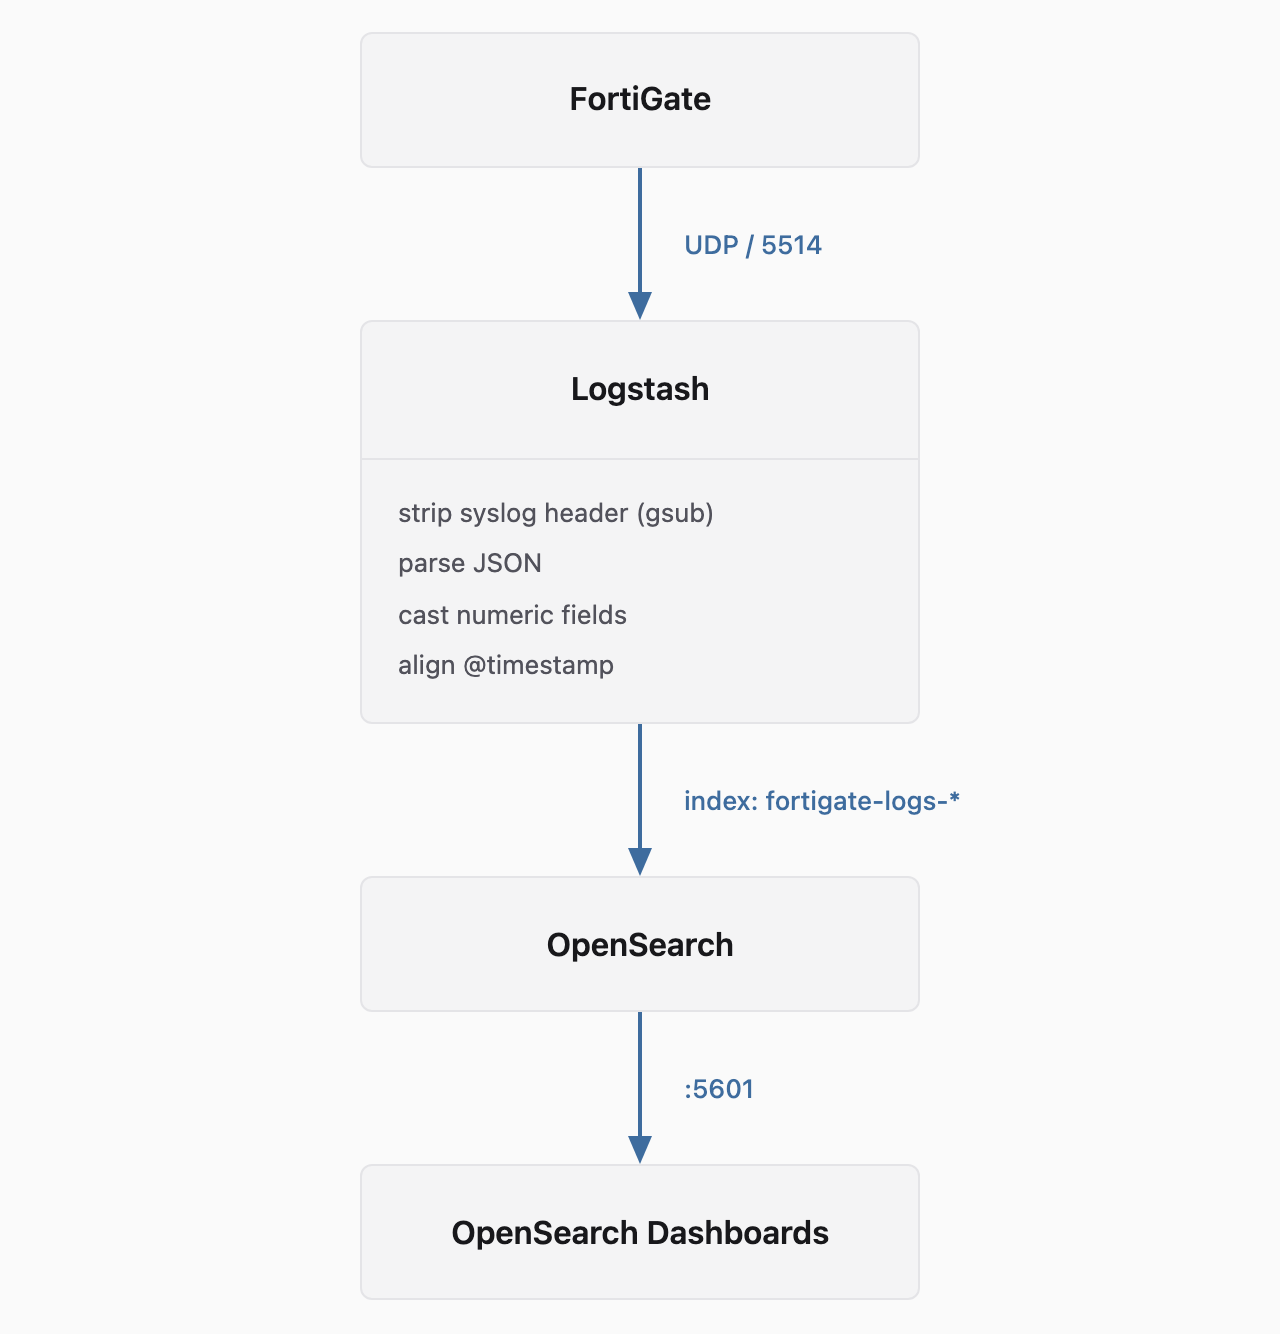
The firewall emits JSON directly, so no log parsing grammar is needed anywhere in the chain. Everything below is configuration I actually ran, including the field type trap at the end that cost me more time than the setup itself.
Stage 1: Local Docker deployment#
Written for macOS. macOS holds port 514 for its own syslog, so the host maps 5514 to the container's 514. On a plain Linux server you can use 514:514/udp directly.
Prerequisites#
Install and start Docker Desktop, then open Settings and Resources and give it at least 4 GB of memory, 6 GB preferably. Below that, OpenSearch fails to start.
Configuration files#
mkdir -p ~/fortigate-logs
cd ~/fortigate-logs
Create logstash.conf in that directory. The syslog header is stripped with gsub rather than grok, because gsub tolerates format drift and will not silently drop an entire event when a pattern fails to match:
input {
  udp {
    # Listen on port 514 inside the container
    port => 514
  }
}

filter {
  # 1. Strip the syslog header (e.g. "<189>") with gsub rather than grok
  mutate {
    gsub => [ "message", "^<[0-9]+>\s*", "" ]
  }

  # 2. Parse the remaining pure JSON string
  json {
    source => "message"
    # Drop the original field after a successful parse to save space
    remove_field => ["message"]
  }

  # 3. Cast numeric strings to integers so aggregations work.
  #    This is the step that decides whether the charts work at all.
  if [sentbyte] {
    mutate {
      convert => {
        "sentbyte" => "integer"
        "rcvdbyte" => "integer"
        "sentpkt"  => "integer"
        "rcvdpkt"  => "integer"
        "duration" => "integer"
        "srcport"  => "integer"
        "dstport"  => "integer"
        "policyid" => "integer"
        "sessionid"=> "integer"
        "cpu"      => "integer"
        "mem"      => "integer"
        "disk"     => "integer"
        "bandwidth"=> "integer"
      }
    }
  }

  # 4. Use the firewall's own timestamp instead of Logstash receive time
  if [date] and [time] and [tz] {
    mutate {
      add_field => { "fg_timestamp" => "%{date} %{time} %{tz}" }
    }
    date {
      match => [ "fg_timestamp", "yyyy-MM-dd HH:mm:ss Z" ]
      target => "@timestamp"
      remove_field => [ "fg_timestamp", "date", "time", "tz" ]
    }
  }
}

output {
  opensearch {
    hosts => ["http://opensearch:9200"]
    # One index per day
    index => "fortigate-logs-%{+YYYY.MM.dd}"

    # Disable template management and ECS for OpenSearch 3.x compatibility
    manage_template => false
    ecs_compatibility => disabled
  }
}
Then docker-compose.yml alongside it:
services:
  opensearch:
    image: opensearchproject/opensearch:latest
    container_name: opensearch
    environment:
      - discovery.type=single-node
      - DISABLE_SECURITY_PLUGIN=true
      - "OPENSEARCH_JAVA_OPTS=-Xms1g -Xmx1g"
    ports:
      - "9200:9200"
      - "9600:9600"
    restart: unless-stopped

  opensearch-dashboards:
    image: opensearchproject/opensearch-dashboards:latest
    container_name: opensearch-dashboards
    environment:
      - OPENSEARCH_HOSTS=http://opensearch:9200
      - DISABLE_SECURITY_DASHBOARDS_PLUGIN=true
    ports:
      - "5601:5601"
    depends_on:
      - opensearch
    restart: unless-stopped

  logstash:
    image: opensearchproject/logstash-oss-with-opensearch-output-plugin:latest
    container_name: logstash
    volumes:
      - ./logstash.conf:/usr/share/logstash/pipeline/logstash.conf:ro
    ports:
      # Host 5514 maps to container 514, since macOS holds 514
      - "5514:514/udp"
    depends_on:
      - opensearch
    restart: unless-stopped
The top level version key is deprecated in current Docker Compose and only produces a warning, so it is omitted here.
Start the services#
docker compose up -dGive it a minute or two, until http://localhost:5601 responds.
Stage 2: FortiGate configuration#
Log all sessions#
Without this, the firewall only records blocked traffic and security events. Normal outbound traffic never reaches the log, and every bandwidth chart later on will be empty.
- Log in to the firewall web interface
- Go to Policy and Objects, then Firewall Policy
- Edit the policy that allows internal traffic out, usually the lan to wan one
- Scroll to the bottom and find Log Allowed Traffic
- Change it from Security Events to All Sessions
- Save
JSON syslog over the CLI#
The FortiGate web interface cannot set the syslog output format, so this part has to go through the CLI. Open the console with the >_ icon in the top right:
config log syslogd setting
    set status enable
    # Address of the machine running Docker
    set server <docker-host-ip>
    # Port as mapped on the host: 5514 on macOS, 514 on Linux
    set mode udp
    set port <5514-or-514>
    # The important one: emit JSON rather than CSV
    set format json
end
The firewall starts sending immediately after this.
Stage 3: Dashboards setup#
Dark mode#
Open http://localhost:5601, go to Stack Management and Advanced Settings, search for Dark mode, turn it on, save, and reload. Purely cosmetic and unrelated to anything below.
Index pattern#
So Dashboards recognises the incoming data:
- Stack Management, then Index Patterns
- Create index pattern
- Name it
fortigate-logs-* - Choose
@timestampas the time field - Create index pattern
Stage 4: 30 day retention#
Firewall logs grow without bound, so index state management handles the deletion.
Open Dev Tools under Management and run PUT _plugins/_ism/policies/delete_after_30_days with this body:
{
  "policy": {
    "description": "Auto delete FortiGate logs older than 30 days",
    "default_state": "hot",
    "states": [
      {
        "name": "hot",
        "actions": [],
        "transitions": [
          {
            "state_name": "delete",
            "conditions": {
              "min_index_age": "30d"
            }
          }
        ]
      },
      {
        "name": "delete",
        "actions": [
          {
            "delete": {}
          }
        ],
        "transitions": []
      }
    ],
    "ism_template": [
      {
        "index_patterns": [
          "fortigate-logs-*"
        ],
        "priority": 100
      }
    ]
  }
}
Stage 5: Charts and dashboard through the API#
Building charts by clicking through the interface is slow and has to be repeated on every new machine. The Saved Objects API turns all of it into a script.
Every request below carries ?overwrite=true, so they are safe to re-run without hitting a 409 conflict.
Index pattern with byte formatting#
fieldFormatMap tells the system these fields are byte counts, so tables and charts render them as KB, MB, and GB rather than raw integers:
OSD_URL="http://localhost:5601"

curl -X POST "${OSD_URL}/api/saved_objects/index-pattern/fortigate-logs-pattern?overwrite=true" \
  -H "osd-xsrf: true" \
  -H "Content-Type: application/json" \
  -d '{
    "attributes": {
      "title": "fortigate-logs-*",
      "timeFieldName": "@timestamp",
      "fieldFormatMap": "{\"rcvdbyte\":{\"id\":\"bytes\"},\"sentbyte\":{\"id\":\"bytes\"}}"
    }
  }'
Bandwidth in Mbps (TSVB)#
TSVB can do arithmetic on aggregation results, which is what turns a byte sum into a rate: multiply by 0.008 and divide by the bucket interval.
curl -X POST "${OSD_URL}/api/saved_objects/visualization/fortigate-bandwidth-mbps?overwrite=true" \
  -H "osd-xsrf: true" \
  -H "Content-Type: application/json" \
  -d '{
    "attributes": {
      "title": "API Created - Bandwidth Trend (Mbps)",
      "visState": "{\"title\":\"Bandwidth Trend (Mbps)\",\"type\":\"metrics\",\"params\":{\"id\":\"1\",\"type\":\"timeseries\",\"series\":[{\"id\":\"rcvd\",\"color\":\"#68BC00\",\"split_mode\":\"everything\",\"metrics\":[{\"id\":\"1\",\"type\":\"sum\",\"field\":\"rcvdbyte\"},{\"id\":\"2\",\"type\":\"math\",\"variables\":[{\"id\":\"v1\",\"name\":\"sum\",\"metric\":\"1\"}],\"script\":\"params.sum * 0.008 / params._interval\"}],\"separate_axis\":0,\"axis_position\":\"left\",\"formatter\":\"number\",\"value_template\":\"{{value}} Mbps\",\"label\":\"Received (Mbps)\",\"line_width\":2,\"fill\":0.2},{\"id\":\"sent\",\"color\":\"#00A69B\",\"split_mode\":\"everything\",\"metrics\":[{\"id\":\"3\",\"type\":\"sum\",\"field\":\"sentbyte\"},{\"id\":\"4\",\"type\":\"math\",\"variables\":[{\"id\":\"v2\",\"name\":\"sum\",\"metric\":\"3\"}],\"script\":\"params.sum * 0.008 / params._interval\"}],\"separate_axis\":0,\"axis_position\":\"left\",\"formatter\":\"number\",\"value_template\":\"{{value}} Mbps\",\"label\":\"Sent (Mbps)\",\"line_width\":2,\"fill\":0.2}],\"time_field\":\"@timestamp\",\"index_pattern\":\"fortigate-logs-*\",\"interval\":\"auto\",\"axis_position\":\"left\",\"axis_formatter\":\"number\",\"show_legend\":1,\"show_grid\":1}}",
      "uiStateJSON": "{}",
      "description": "Historical bandwidth usage in true Mbps using TSVB math aggregations",
      "version": 1,
      "kibanaSavedObjectMeta": {
        "searchSourceJSON": "{\"query\":{\"query\":\"\",\"language\":\"kuery\"},\"filter\":[]}"
      }
    }
  }'
Network flow sunburst#
Rings from the inside out: source IP, destination IP, destination port.
curl -X POST "${OSD_URL}/api/saved_objects/visualization/fortigate-network-flow-sunburst?overwrite=true" \
  -H "osd-xsrf: true" \
  -H "Content-Type: application/json" \
  -d '{
    "attributes": {
      "title": "API Created - Network Flow (Sunburst)",
      "visState": "{\"title\":\"Network Flow (Sunburst)\",\"type\":\"pie\",\"params\":{\"type\":\"pie\",\"addTooltip\":true,\"addLegend\":false,\"legendPosition\":\"right\",\"isDonut\":true,\"labels\":{\"show\":true,\"values\":true,\"last_level\":true,\"truncate\":100}},\"aggs\":[{\"id\":\"1\",\"enabled\":true,\"type\":\"count\",\"schema\":\"metric\",\"params\":{}},{\"id\":\"2\",\"enabled\":true,\"type\":\"terms\",\"schema\":\"segment\",\"params\":{\"field\":\"srcip.keyword\",\"size\":5,\"order\":\"desc\",\"orderBy\":\"1\",\"customLabel\":\"Source IP\"}},{\"id\":\"3\",\"enabled\":true,\"type\":\"terms\",\"schema\":\"segment\",\"params\":{\"field\":\"dstip.keyword\",\"size\":5,\"order\":\"desc\",\"orderBy\":\"1\",\"customLabel\":\"Destination IP\"}},{\"id\":\"4\",\"enabled\":true,\"type\":\"terms\",\"schema\":\"segment\",\"params\":{\"field\":\"dstport\",\"size\":5,\"order\":\"desc\",\"orderBy\":\"1\",\"customLabel\":\"Dest Port\"}}]}",
      "uiStateJSON": "{}",
      "description": "Visualizes the flow of traffic from Source IP to Destination IP and Port",
      "version": 1,
      "kibanaSavedObjectMeta": {
        "searchSourceJSON": "{\"query\":{\"query\":\"\",\"language\":\"kuery\"},\"filter\":[],\"indexRefName\":\"kibanaSavedObjectMeta.searchSourceJSON.index\"}"
      }
    },
    "references": [
      {
        "name": "kibanaSavedObjectMeta.searchSourceJSON.index",
        "type": "index-pattern",
        "id": "fortigate-logs-pattern"
      }
    ]
  }'
Top sources by traffic#
Source IPs ranked by total bytes in each direction, top 10.
Worth recording the mistake I made here first. I originally wanted one chart showing both the top sources and the top destinations, and implemented it by adding a filters aggregation with two buckets labelled Top Sources and Top Destinations. Both filters used the query *, and the terms aggregation underneath only grouped on srcip. The result looked plausible and was meaningless: the same source data rendered twice under two different labels, with no destination dimension anywhere in the chart.
A single visualization cannot rank two different fields in one pass. The honest version is two charts: this one for sources, and a duplicate with field changed to dstip.keyword for destinations.
curl -X POST "${OSD_URL}/api/saved_objects/visualization/fortigate-top-sources?overwrite=true" \
  -H "osd-xsrf: true" \
  -H "Content-Type: application/json" \
  -d '{
    "attributes": {
      "title": "API Created - Top Sources by Traffic",
      "visState": "{\"title\":\"Top Sources by Traffic\",\"type\":\"horizontal_bar\",\"params\":{\"type\":\"histogram\",\"grid\":{\"categoryLines\":false},\"categoryAxes\":[{\"id\":\"CategoryAxis-1\",\"type\":\"category\",\"position\":\"left\",\"show\":true,\"style\":{},\"scale\":{\"type\":\"linear\"},\"labels\":{\"show\":true,\"filter\":true,\"truncate\":100},\"title\":{}}],\"valueAxes\":[{\"id\":\"ValueAxis-1\",\"name\":\"LeftAxis-1\",\"type\":\"value\",\"position\":\"bottom\",\"show\":true,\"style\":{},\"scale\":{\"type\":\"linear\",\"mode\":\"normal\"},\"labels\":{\"show\":true,\"rotate\":0,\"filter\":false,\"truncate\":100},\"title\":{\"text\":\"Total Traffic\"}}],\"seriesParams\":[{\"show\":true,\"type\":\"histogram\",\"mode\":\"stacked\",\"data\":{\"label\":\"Downloaded\",\"id\":\"1\"},\"valueAxis\":\"ValueAxis-1\",\"drawLinesBetweenPoints\":true,\"lineWidth\":2,\"showCircles\":true},{\"show\":true,\"type\":\"histogram\",\"mode\":\"stacked\",\"data\":{\"label\":\"Uploaded\",\"id\":\"2\"},\"valueAxis\":\"ValueAxis-1\",\"drawLinesBetweenPoints\":true,\"lineWidth\":2,\"showCircles\":true}],\"addTooltip\":true,\"addLegend\":true,\"legendPosition\":\"right\",\"times\":[],\"addTimeMarker\":false},\"aggs\":[{\"id\":\"1\",\"enabled\":true,\"type\":\"sum\",\"schema\":\"metric\",\"params\":{\"field\":\"rcvdbyte\",\"customLabel\":\"Downloaded\"}},{\"id\":\"2\",\"enabled\":true,\"type\":\"sum\",\"schema\":\"metric\",\"params\":{\"field\":\"sentbyte\",\"customLabel\":\"Uploaded\"}},{\"id\":\"3\",\"enabled\":true,\"type\":\"terms\",\"schema\":\"segment\",\"params\":{\"field\":\"srcip.keyword\",\"size\":10,\"order\":\"desc\",\"orderBy\":\"1\",\"customLabel\":\"Source IP\"}}]}",
      "uiStateJSON": "{}",
      "description": "Top 10 source IPs ranked by total traffic",
      "version": 1,
      "kibanaSavedObjectMeta": {
        "searchSourceJSON": "{\"query\":{\"query\":\"\",\"language\":\"kuery\"},\"filter\":[],\"indexRefName\":\"kibanaSavedObjectMeta.searchSourceJSON.index\"}"
      }
    },
    "references": [
      {
        "name": "kibanaSavedObjectMeta.searchSourceJSON.index",
        "type": "index-pattern",
        "id": "fortigate-logs-pattern"
      }
    ]
  }'
Session detail list#
A saved search, available directly in Discover:
curl -X POST "${OSD_URL}/api/saved_objects/search/fortigate-detailed-sessions?overwrite=true" \
  -H "osd-xsrf: true" \
  -H "Content-Type: application/json" \
  -d '{
    "attributes": {
      "title": "API Created - Detailed Sessions (Saved Search)",
      "description": "Raw session details table (find it in Discover)",
      "hits": 0,
      "columns": [
        "srcip",
        "srcport",
        "dstip",
        "dstport",
        "action",
        "service",
        "sentbyte",
        "rcvdbyte",
        "duration"
      ],
      "sort": [
        [
          "@timestamp",
          "desc"
        ]
      ],
      "version": 1,
      "kibanaSavedObjectMeta": {
        "searchSourceJSON": "{\"query\":{\"query\":\"\",\"language\":\"kuery\"},\"filter\":[],\"indexRefName\":\"kibanaSavedObjectMeta.searchSourceJSON.index\"}"
      }
    },
    "references": [
      {
        "name": "kibanaSavedObjectMeta.searchSourceJSON.index",
        "type": "index-pattern",
        "id": "fortigate-logs-pattern"
      }
    ]
  }'
Session aggregation table#
Five levels of nested terms: source IP, source port, destination IP, destination port, action.
Nested terms aggregations expand as a cartesian product. Five levels at size: 15 each puts the theoretical ceiling near 760,000 buckets. On test data this is invisible. On real firewall log volume it is slow and can exhaust memory. If you only need the raw rows, the saved search above is the better tool. If you genuinely need the aggregation table, drop it to two or three levels.
curl -X POST "${OSD_URL}/api/saved_objects/visualization/fortigate-detailed-sessions-vis?overwrite=true" \
  -H "osd-xsrf: true" \
  -H "Content-Type: application/json" \
  -d '{
    "attributes": {
      "title": "API Created - Detailed Sessions (Vis)",
      "visState": "{\"title\":\"Detailed Sessions (Vis)\",\"type\":\"table\",\"params\":{\"perPage\":15,\"showPartialRows\":false,\"showMetricsAtAllLevels\":false,\"sort\":{\"columnIndex\":null,\"direction\":null},\"showTotal\":false,\"totalFunc\":\"sum\"},\"aggs\":[{\"id\":\"1\",\"enabled\":true,\"type\":\"count\",\"schema\":\"metric\",\"params\":{}},{\"id\":\"2\",\"enabled\":true,\"type\":\"terms\",\"schema\":\"bucket\",\"params\":{\"field\":\"srcip.keyword\",\"size\":15,\"order\":\"desc\",\"orderBy\":\"1\",\"customLabel\":\"Source IP\"}},{\"id\":\"3\",\"enabled\":true,\"type\":\"terms\",\"schema\":\"bucket\",\"params\":{\"field\":\"srcport\",\"size\":15,\"order\":\"desc\",\"orderBy\":\"1\",\"customLabel\":\"Src Port\"}},{\"id\":\"4\",\"enabled\":true,\"type\":\"terms\",\"schema\":\"bucket\",\"params\":{\"field\":\"dstip.keyword\",\"size\":15,\"order\":\"desc\",\"orderBy\":\"1\",\"customLabel\":\"Dest IP\"}},{\"id\":\"5\",\"enabled\":true,\"type\":\"terms\",\"schema\":\"bucket\",\"params\":{\"field\":\"dstport\",\"size\":15,\"order\":\"desc\",\"orderBy\":\"1\",\"customLabel\":\"Dst Port\"}},{\"id\":\"6\",\"enabled\":true,\"type\":\"terms\",\"schema\":\"bucket\",\"params\":{\"field\":\"action.keyword\",\"size\":15,\"order\":\"desc\",\"orderBy\":\"1\",\"customLabel\":\"Action\"}}]}",
      "uiStateJSON": "{}",
      "description": "Aggregated sessions table for the Visualize menu",
      "version": 1,
      "kibanaSavedObjectMeta": {
        "searchSourceJSON": "{\"query\":{\"query\":\"\",\"language\":\"kuery\"},\"filter\":[],\"indexRefName\":\"kibanaSavedObjectMeta.searchSourceJSON.index\"}"
      }
    },
    "references": [
      {
        "name": "kibanaSavedObjectMeta.searchSourceJSON.index",
        "type": "index-pattern",
        "id": "fortigate-logs-pattern"
      }
    ]
  }'
Assembling the dashboard#
Rate chart across the top, top sources and the flow sunburst side by side in the middle, session detail along the bottom:
curl -X POST "${OSD_URL}/api/saved_objects/dashboard/fortigate-main-dashboard?overwrite=true" \
  -H "osd-xsrf: true" \
  -H "Content-Type: application/json" \
  -d '{
    "attributes": {
      "title": "API Created - FortiGate Main Dashboard",
      "hits": 0,
      "description": "Bandwidth trend, top sources, network flow, and session details",
      "panelsJSON": "[{\"gridData\":{\"w\":48,\"h\":15,\"x\":0,\"y\":0,\"i\":\"1\"},\"version\":\"1\",\"panelIndex\":\"1\",\"type\":\"visualization\",\"id\":\"fortigate-bandwidth-mbps\",\"embeddableConfig\":{}},{\"gridData\":{\"w\":24,\"h\":15,\"x\":0,\"y\":15,\"i\":\"2\"},\"version\":\"1\",\"panelIndex\":\"2\",\"type\":\"visualization\",\"id\":\"fortigate-top-sources\",\"embeddableConfig\":{}},{\"gridData\":{\"w\":24,\"h\":15,\"x\":24,\"y\":15,\"i\":\"3\"},\"version\":\"1\",\"panelIndex\":\"3\",\"type\":\"visualization\",\"id\":\"fortigate-network-flow-sunburst\",\"embeddableConfig\":{}},{\"gridData\":{\"w\":48,\"h\":20,\"x\":0,\"y\":30,\"i\":\"4\"},\"version\":\"1\",\"panelIndex\":\"4\",\"type\":\"search\",\"id\":\"fortigate-detailed-sessions\",\"embeddableConfig\":{}}]",
      "optionsJSON": "{\"useMargins\":true,\"hidePanelTitles\":false}",
      "version": 1,
      "timeRestore": false,
      "kibanaSavedObjectMeta": {
        "searchSourceJSON": "{\"query\":{\"query\":\"\",\"language\":\"kuery\"},\"filter\":[]}"
      }
    },
    "references": [
      {
        "name": "panel_0",
        "type": "visualization",
        "id": "fortigate-bandwidth-mbps"
      },
      {
        "name": "panel_1",
        "type": "visualization",
        "id": "fortigate-top-sources"
      },
      {
        "name": "panel_2",
        "type": "visualization",
        "id": "fortigate-network-flow-sunburst"
      },
      {
        "name": "panel_3",
        "type": "search",
        "id": "fortigate-detailed-sessions"
      }
    ]
  }'
Troubleshooting: No data to display#
This is where the setup actually goes wrong, and it took me longer than everything above combined.
Symptom. Data is clearly arriving. Discover shows the events. But the traffic and rate charts are empty, and TSVB will not even let you select the metric field.
Cause. OpenSearch distinguishes strings from numbers strictly. If sentbyte was written as a string, nothing can sum it, and every chart built on a math aggregation fails.
What makes this painful is that mappings are immutable once created. A single event written before the type conversion was in place pins the whole day's index to the string type, and fixing the Logstash config afterwards does not recover that day's data.
Fix. Delete the affected index and let it rebuild.
- Confirm the
logstash.confabove, with theconvertblock, is in place and restart the container:
docker compose restart logstash- In Dev Tools, drop the affected index, substituting the real date:
DELETE fortigate-logs-2026.03.06A response of "acknowledged": true means it is gone. The firewall rebuilds it with the next batch of logs.
- Back in Stack Management and Index Patterns, use the refresh field list button.
sentbyteandrcvdbyteshould now show a#marker for a numeric type, and the charts come back.
The root cause is step 3 of the Logstash filter. It reads like a routine type conversion. It decides whether the entire visualization layer works.